KSE 100 Index: Complete Guide to Pakistan’s Stock Market Benchmark
Learn everything about the KSE 100 Index, including its calculation method, major companies, market trends, KSE 100 Index Chart, KSE 100 Index Graph, and how investors use it to track the Pakistan Stock Exchange.
The KSE 100 Index is the most important stock market index in Pakistan. It represents the performance of the top companies listed on the Pakistan Stock Exchange (PSX) and serves as a benchmark for investors, traders, financial analysts, and businesses.
Whenever people search for KSE 100 Index Today, PSX 100 Index Today, or stock market performance, they usually want to know whether the market is moving up or down and what factors are affecting investor sentiment. The KSE-100 Index provides this information in a single number, making it easier to understand the overall health of the stock market.
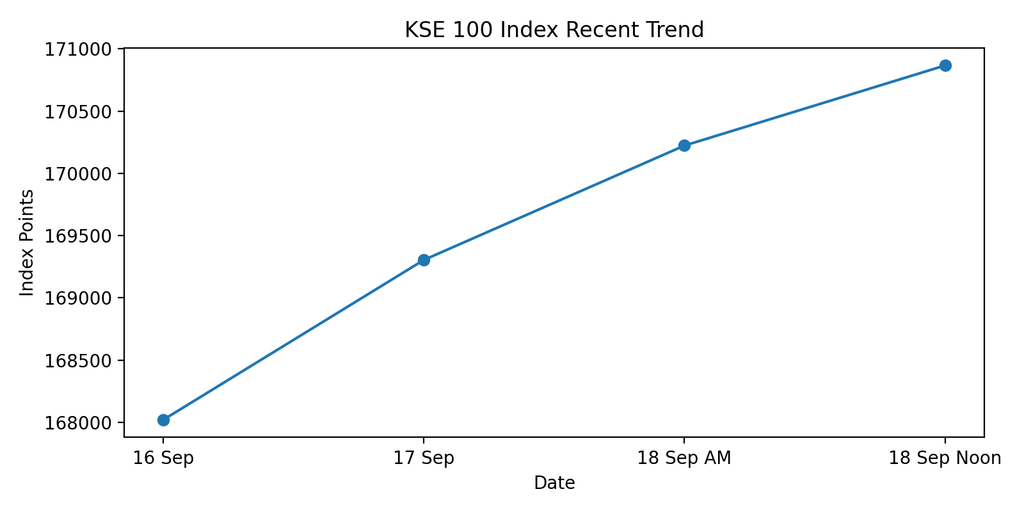
Recent market data shows the benchmark index trading around the 170,000-point range, reflecting the performance of leading companies listed on the Pakistan Stock Exchange.
What is the KSE 100 Index?
The KSE-100 Index is the flagship index of the Pakistan Stock Exchange. It consists of 100 representative companies selected from different sectors of the economy. The index was introduced in 1991 and is widely used to measure the overall performance of Pakistan’s equity market.
The purpose of the index is to provide investors with a reliable indicator of market performance and economic activity.
Key Features
- Represents 100 major listed companies
- Covers multiple sectors of the economy
- Acts as the benchmark index of PSX
- Used by local and international investors
- Reflects overall market sentiment
Karachi Stock Exchange 100 Index Today
Many investors still search for Karachi Stock Exchange 100 Index Today, although the Karachi Stock Exchange became part of the Pakistan Stock Exchange (PSX) after the integration of Pakistan’s stock exchanges.
Today, the index remains the most-followed indicator of Pakistan’s capital markets. Investors monitor it daily to evaluate:
- Market direction
- Investor confidence
- Economic outlook
- Sector performance
- Investment opportunities
How is the KSE 100 Index Calculated?
The index is primarily based on market capitalization. Companies with larger market values have a greater impact on the movement of the index.
Factors affecting the index include:
1. Company Earnings
Strong profits generally push stock prices higher.
2. Interest Rates
Lower interest rates often encourage investment in stocks.
3. Inflation
Inflation can affect company profitability and investor sentiment.
4. Political Stability
Political and economic certainty often supports market growth.
5. Foreign Investment
Foreign inflows can significantly impact market performance.
Major Sectors Included in the KSE 100 Index
The index includes companies from:
| Sector | Importance |
|---|---|
| Banking | Major contributor to market capitalization |
| Oil & Gas | Influences overall market direction |
| Fertilizer | Important for Pakistan’s economy |
| Cement | Reflects construction activity |
| Technology | Growing investment interest |
| Power & Energy | Essential economic sector |
| Textile | Major export industry |
KSE 100 Index Chart
The KSE 100 Index Chart helps investors understand historical market performance and identify trends.
A chart typically shows:
- Daily movement
- Weekly trends
- Monthly performance
- Yearly growth
- Support and resistance levels
Example Trend Analysis
| Time Period | What Investors Look For |
|---|---|
| 1 Day | Short-term movement |
| 1 Week | Market momentum |
| 1 Month | Trend direction |
| 6 Months | Medium-term performance |
| 1 Year | Long-term growth |
By studying the KSE 100 Index Chart, investors can make better-informed decisions instead of relying on emotions.
KSE 100 Index Graph
The KSE 100 Index Graph provides a visual representation of market performance.
Investors use graphs to identify:
- Bullish trends
- Bearish trends
- Market corrections
- Breakouts
- Historical highs and lows
A graph makes it easier to understand market behavior and compare current performance with previous periods.
KSE 100 Index Live Updates
Many traders follow KSE 100 Index Live data during market hours.
Live updates generally include:
- Current index value
- Percentage change
- Trading volume
- Market turnover
- Top gainers
- Top losers
Real-time information helps traders react quickly to market developments and manage risk effectively. Live market trackers and PSX data services provide continuously updated index values throughout the trading session.
Why Investors Follow PSX 100 Index Today
Monitoring PSX 100 Index Today provides several benefits:
Market Sentiment
Shows whether investors are optimistic or cautious.
Economic Indicator
Often reflects business and economic activity.
Portfolio Benchmark
Investors compare their portfolio performance against the index.
Investment Opportunities
Helps identify strong and weak sectors.
Factors That Can Move the KSE 100 Index
Several events can influence market performance:
- Monetary policy decisions
- Inflation announcements
- Currency fluctuations
- Corporate earnings reports
- Government policies
- Global market trends
- International commodity prices
Understanding these factors helps investors interpret daily market movements more accurately.
Advantages of Investing in Companies Within the KSE 100
Investors often prefer companies included in the index because they generally have:
- Strong financial performance
- High liquidity
- Better transparency
- Larger market capitalization
- Greater investor confidence
These characteristics can make them attractive for long-term investment strategies.
Future Outlook of Pakistan’s Stock Market
Pakistan’s stock market continues to attract attention from domestic and international investors. Growth in technology, banking, energy, and industrial sectors may create new opportunities in the future.
However, investors should always conduct proper research, evaluate risks, and avoid making decisions based solely on short-term market fluctuations.
Conclusion
The KSE 100 Index remains the most important indicator of Pakistan’s stock market performance. Whether you are searching for KSE 100 Index Today, Karachi Stock Exchange 100 Index Today, KSE 100 Index Chart, KSE 100 Index Graph, KSE 100 Index Live, or PSX 100 Index Today, understanding how the index works can help you make more informed investment decisions and stay updated with the latest trends in Pakistan’s financial markets.